Summary
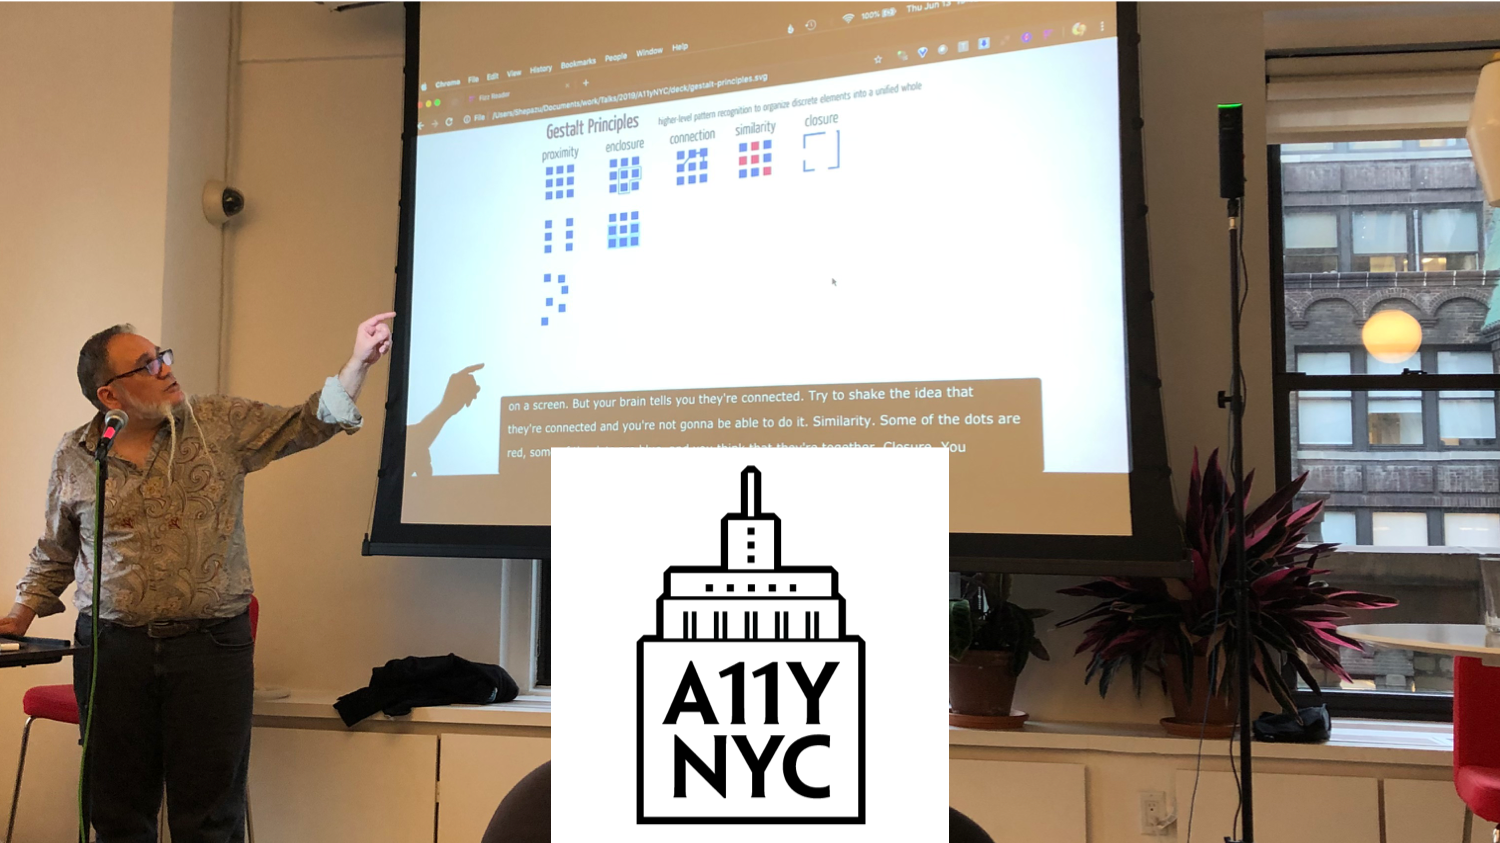
On June 13, Accessibility New York City hosted a meetup entitled “Data Visualization: Tips for Making Complex Graphical Content Accessible to All”. Presenter Doug Schepers, described in depth how humans process complex graphical information. He shared an extremely engaging presentation that was thought provoking and demonstrative of a way forward for making data visualization more inclusive.
Here are some of our highlights from the presentation:
- Example of an Audible Tactile Map
- New Vocabulary Explaining “Deep Graphics” Concept
- Data Tables are not Equivalent Access
