Summary
Based on Dr. Angela Young’s A11yNYC talk, this explores how inclusive design transforms raw data into stories everyone can understand and act on. They unpacked the hidden costs of inaccessible dashboards, explained how to design for access from the start, and showed how storytelling can make complex data clear and memorable. The takeaway: Accessible data design is more than compliance. It’s a strategy for clarity, equity, and trust. When organizations build accessibility into every chart, caption, and narrative, they turn information into insight and ensure that every voice can participate in decision-making.
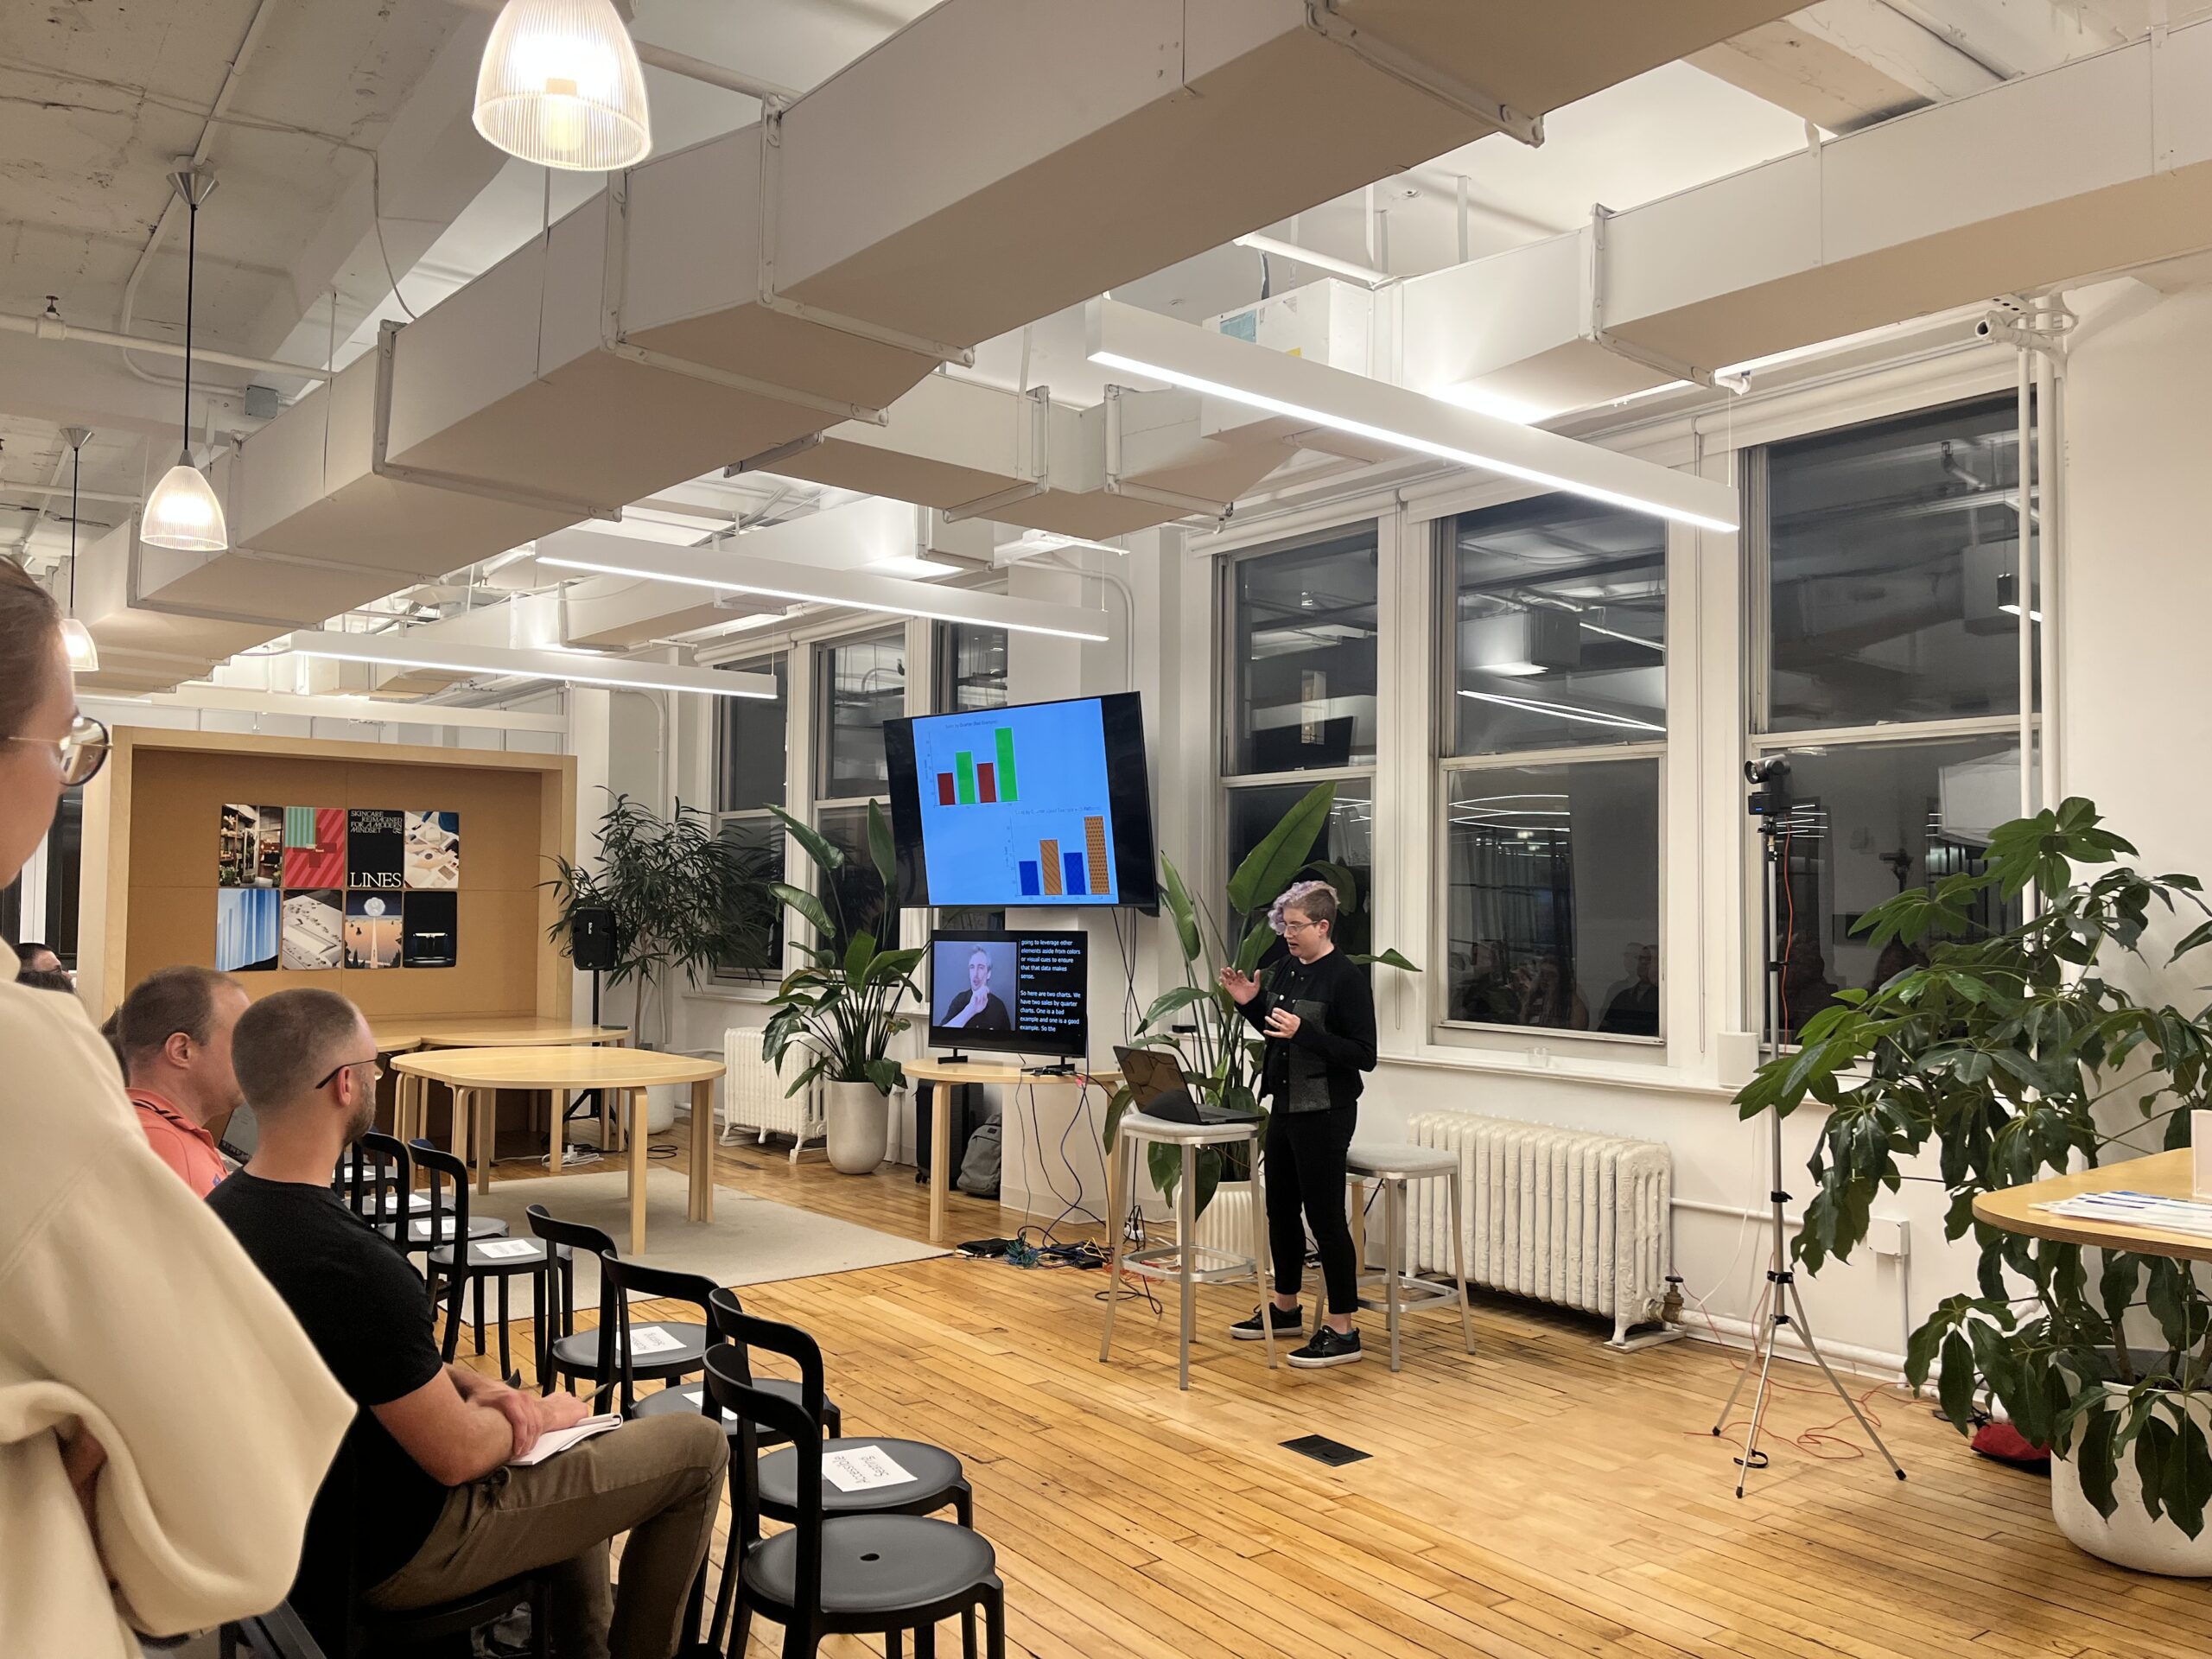
This article is based on Dr. Angela Young‘s talk at A11yNYC, which explored how accessibility transforms data from a static report into a shared story that drives understanding and action.
Organizations collect more data than ever before. Yet many teams struggle to turn those numbers into insights everyone can use. Angela tackled one of the most persistent challenges in digital communication: How to make data meaningful, inclusive, and equitable.
Their approach was practical and grounded in lived experience. They didn’t dwell on theory or compliance checklists. Instead, they focused on real-world friction. How inaccessible design decisions, often made with good intentions, quietly reinforce exclusion. The message was clear: If your data isn’t accessible, it isn’t complete.
The hidden cost of inaccessible dashboards
Data visualization can make or break understanding. Charts, dashboards, and infographics are supposed to simplify complexity. But when designed without accessibility, they obscure meaning and exclude people. Angela described this as a silent problem. When only a few can interpret the data, decision-making turns into an exclusionary exercise.
Too often, teams prioritize aesthetics without realizing that those choices can become barriers. Aesthetics include vibrant colors, sleek visuals, and interactive filters. Flattened images of charts, hover-only filters, and color-coded categories without labels might look polished, but they silently tell some users: This data isn’t for you.
Angela shared a vivid example. In one project, a data dashboard was created as a single static image. It seemed harmless until a colleague with low vision couldn’t access it. Suddenly, an entire perspective was missing from the conversation. The solution was simple education and redesign, but the takeaway was deeper. Accessibility isn’t a technical fix. It’s a structural responsibility.
When data isn’t accessible, then you’re leaving the decision-making to only a portion of the available audience. This isn’t equity.
They also highlighted cognitive overload as another common pitfall. Dashboards overflowing with charts and metrics can overwhelm users, especially those with cognitive or learning disabilities. Cluttered layouts, unlabeled filters, and poor navigation increase cognitive effort and fatigue.
Designing for access from the start
Angela urged teams to rethink how they approach accessibility. It shouldn’t be bolted on after launch. It should be integrated from the first sketch. “Accessibility isn’t perfection. It’s vigilance,” they said. “It’s the ongoing habit of checking assumptions.”
They shared several principles for designing accessible data experiences from the beginning:
- Use sufficient color contrast. Follow WCAG standards, maintaining at least a 4.5:1 ratio for text and visuals.
- Label everything clearly. Descriptive axis titles and legends are essential; avoid placeholders like “Series 1.”
- Don’t rely on color alone. Reinforce meaning with patterns, textures, or direct labels.
- Keep text legible. Sans-serif fonts in 12–14 points work well, and all caps should be avoided for readability.
- Make interactions accessible. Filters and dashboards should be keyboard navigable and screen reader compatible.
- Write meaningful alt text. Describe insights, not just shapes or colors.
In practice, this means designing for comprehension, not just presentation. Accessibility is design that anticipates difference rather than reacting to it. Each of these ensures that data is usable by more people and that no single group holds the keys to understanding. Accessibility transforms data from something presented to something shared.
Simplifying for meaning
Complexity doesn’t automatically create clarity. Angela urged teams to resist the temptation to display every data point. Overloaded dashboards filled with decimals, percentages, and long tables make it harder for users to find the story behind the numbers.
They recommended focusing on the trends that matter most. Summaries and key callouts help people understand the message quickly. A brief statement like “Revenue grew 17% last quarter” is often more effective than a page of raw figures. The goal is to guide readers toward insights, not overwhelm them with details.
Whitespace supports this clarity. Many designers treat empty space as wasted real estate, but it functions as a visual breathing room that helps users separate ideas and process information. Accessible dashboards aren’t about flash. They’re about comprehension.
Writing alt text that tells the story
Angela emphasized that alt text should communicate meaning, not just describe visuals. Too often, alt text for charts lists colors and shapes without explaining what they show. Instead, the description should summarize the takeaway of the visualization.
A good example would be writing, “Bar chart comparing monthly sales for Product A and Product B, showing a 20% increase for Product A in August.” This phrasing conveys the story within the data rather than its structure.
Treating alt text as part of the design process has another advantage: it forces teams to clarify what they want each chart to say. If a visualization can’t be described in one or two sentences, it may not be telling a coherent story. Alt text, then, becomes an accessibility tool and a storytelling discipline.
Building structure and layout for understanding
Accessibility is about more than color and text contrast. It’s about how information is structured. Angela pointed out that even well-designed charts can fail if the layout creates friction. Legends that sit far from their corresponding visuals, filters hidden behind hover states, or dashboards that require precise mouse actions can all block access.
Good structure makes it easier to follow a narrative. Related elements should be grouped together, spacing should be consistent, and unnecessary visuals should be removed. Testing designs with real users, rather than relying solely on automated tools, reveals where confusion or barriers still exist.
Responsive design also matters. Dashboards should function on mobile devices and low-bandwidth connections and work with screen readers. Accessibility, at its core, is adaptability. Creating experiences that work for everyone, not just the average user.
Turning data into stories
People remember stories far better than they remember raw numbers. Angela’s framework for accessible storytelling brings together three layers that make data more human:
- Visual layer: Colors, labels, and structure that make information perceivable.
- Language layer: Captions, summaries, and alt text that make it understandable.
- Interaction layer: Controls, filters, and exports that make it operable.
When these layers work in harmony, data transforms from an abstract display into a shared narrative. Plain-language summaries, consistent phrasing across visuals, and clear headlines all help readers find meaning faster.
Effective data storytelling does more than make numbers emotional. It also makes them relatable. By organizing visuals in a way that mirrors how people read and process information, teams can help audiences understand complex insights without needing specialized training.
Seeing data as dialogue
Angela described data as a conversation rather than a monologue. A dashboard needs to be more than just displaying information to be consumed. It should invite interaction, reflection, and collaboration. When data is accessible, it encourages participation from everyone, not limited to those who are already comfortable interpreting charts.
This shift from presentation to dialogue democratizes knowledge. Instead of a small group of analysts or designers holding the keys to interpretation, accessibility opens the conversation to more voices. When more people can access and understand the data, the insights become richer and more representative.
Accessible storytelling also reduces friction. A clear narrative, consistent structure, and inclusive design allow users to engage with the material immediately. Instead of deciphering visuals, they can focus on problem-solving and decision-making.
Accessibility as a signal of trust
Beyond usability, accessibility signals credibility. When organizations consistently present information in formats that everyone can understand, they build trust. Users come to expect clarity and inclusion, and that expectation strengthens engagement.
Inaccessible dashboards, on the other hand, concentrate knowledge in the hands of a few “data gatekeepers.” Those who can interpret complex visuals end up making decisions for everyone else. Accessible design removes that imbalance. It makes transparency and participation part of the organization’s culture.
More than a compliance requirement, accessibility is a demonstration of respect for all users. It shows that every person’s ability to understand information matters equally.
Real-world friction and practical fixes
Angela’s examples illustrated that accessibility challenges are rarely about neglect. They’re about awareness. In one client project, performance charts relied entirely on red and green bars. For colorblind users, the entire message was lost. In another case, filters were available only through mouse hover actions, making them invisible to keyboard users.
These aren’t unusual mistakes. They’re common across industries. The key is how teams respond. Angela encouraged treating accessibility gaps as opportunities to learn rather than failures to be corrected. Each small improvement expands access and reduces exclusion.
They also acknowledged that accessibility work happens within constraints, such as tight schedules, competing priorities, and legacy systems. The goal isn’t perfection but progress. Every accessible choice, no matter how small, makes a difference.
From data to action
Angela framed accessible storytelling as a three-part narrative arc: set the stage, show the shift, and call to action.
- Set the stage: Provide context for why the dataset matters.
- Show the shift: Explain what changed or what patterns emerged.
- Call to action: Identify what decisions or steps should follow.
A well-structured story presents findings and guides people toward understanding and action. For example, instead of listing engagement rates, tell the story of how accessibility improvements doubled engagement and what that means for future strategy. The data stays the same, but the story makes it memorable.
Accessibility as strategy
Angela outlined a strategy for how organizations can think, communicate, and lead more effectively while designing inclusive charts. Accessible data design fosters clarity, equity, and trust. It ensures that everyone has the same opportunity to understand and act on information.
Accessibility is empathy in process. It’s an intentional effort to include others in understanding. When data storytelling is inclusive, it reflects the diversity of the audience it serves.
In the end, accessibility isn’t a box to check or a compliance hurdle to clear. It’s the foundation for effective communication. If data is meant to drive action, then the story it tells must be one that everyone can read.
Video highlights
- Why accessible data matters
- Designing access from the start
- Turning numbers into narratives
- Empathy and progress in practice
- Q&A with Angela
Watch the presentation
Bio
Dr. Angela Young (they/them) is a queer, nonbinary, multiply disabled accessibility strategist with a passion for transforming complex systems into inclusive experiences. As Lead, Enterprise Technical Accessibility Training and Awareness, Angela helps teams embed accessibility into everyday product decisions.
With a background in education, tech, and design, Angela combines practical training with systems thinking and lived experience. They specialize in demystifying accessibility for devs, designers, and data teams, reminding us that inclusion is not extra work but the real work.
Resources
- Power BI: Microsoft’s flagship BI tool with built-in accessibility features, including keyboard navigation, screen reader support, and alt text for visuals.
- Tableau: Powerful visualization tool; accessibility features are improving, but it requires disciplined design for compliance.
- Excel: Often overlooked, but one of the most screen reader-friendly tools for building accessible charts and tables.
- Flourish: Web-based visualization platform supporting alt text and responsive embeds for inclusive online charts.
- Color Oracle: Free color blindness simulator for checking designs against multiple vision types.
- Stark: Accessibility plugin for Figma, Sketch, and XD; checks color contrast and generates alt text guidance.
- Storytelling with Data (Cole Nussbaumer Knaflic): Classic guide to clarity, simplicity, and storytelling with charts.
- Data Feminism (Catherine D’Ignazio and Lauren Klein): Examines power, equity, and inclusion in how we use and present data.
- Accessibility Guidelines for Data Visualization (WCAG 2.2): WCAG 2.2 documentation applied to data viz contexts.
- Nightingale (Data Visualization Society): Online journal of the Data Visualization Society with many accessibility-oriented articles.
- Tamara Munzner: Author of Visualization Analysis and Design and thought leader in viz theory.
- Andy Kirk: Visualization consultant, trainer, and author of Data Visualization: A Handbook for Data Driven Design
- Nadieh Bremer: Award-winning data visualization designer sharing innovative approaches.
- Stephanie Evergreen: Specialist in data reporting and visualization for clarity and accessibility.
